Posts Tagged ‘Munroe’
See, Think, Design, Produce: Randall Munroe’s Presentation
The last of the three STDP2 presentations I’ll review was by Randall Munroe, creator of the online comic xkcd. I’ve read xkcd for years and am constantly amazed at the quality of his work.
Munroe started out by noting that it’s ridiculously easy to get in your own way by trying to automate a process that can be done perfectly well by hand. As an example, consider a chart showing character interactions in the Star Wars or Lord of the Rings movies.
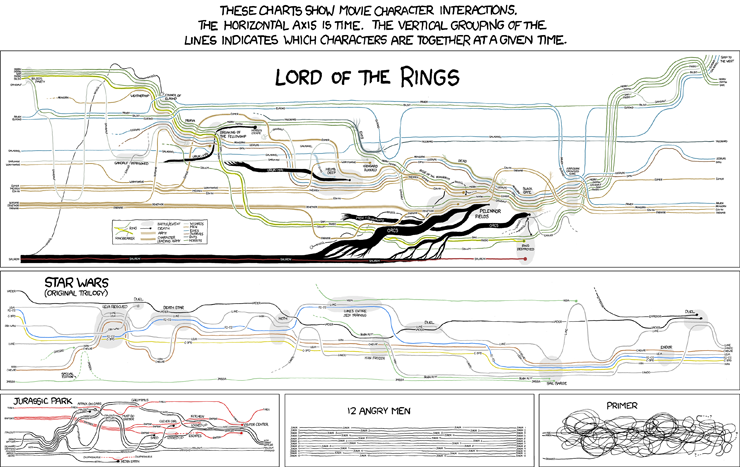
Original source: http://xkcd.com/657/
Gandalf’s a plot hack.
– Randall Munroe
Munroe said that he tried for ten years, off and on, to develop a tool that could translate a script into a character interaction timeline. Finally, frustrated, he drew the graph for the original Star Wars trilogy by hand in an hour. I imagine the timeline for 12 Angry Men took slightly less time to complete.
Displaying data is easy, Munroe argued, but determining which data to show is tough. That said, some presentation modes are better than others. Once he finds an angle he likes, he looks for other ways he can leverage that approach. Recently, he published a graphic on California droughts that uses the physical shape of the state as its axes. I’d love to see this design metaphor used in other graphics.

Original source: http://xkcd.com/1410/
He makes his infographics more palatable by adding humor, such as asides about a specific data point or a joke to indicate that, while he takes the analysis seriously, he doesn’t take himself too seriously. That approach lets him reveal that the Environmental Protection Agency assigns a human life an economic value of $8.2 million when performing cost-benefit analysis without inciting his readers.
Munroe came across as a soft-spoken, gentle person who is still slightly uncomfortable speaking in public. That said, his resolve strengthened when he discussed his wife’s cancer diagnosis and how he communicated the realities of treatment and survival rates. The image that resulted, “Lanes”, is one of the most powerful infographics I’ve encountered.

Original source: http://xkcd.com/931/
He didn’t want to leave us on such a somber note, so he concluded by showing us a graphic called “Lakes and Oceans” that he thought was interesting but nothing special. It shows the relative depths of various bodies of water and the ocean floor. He was surprised to discover it was one of the most popular things he published that year.
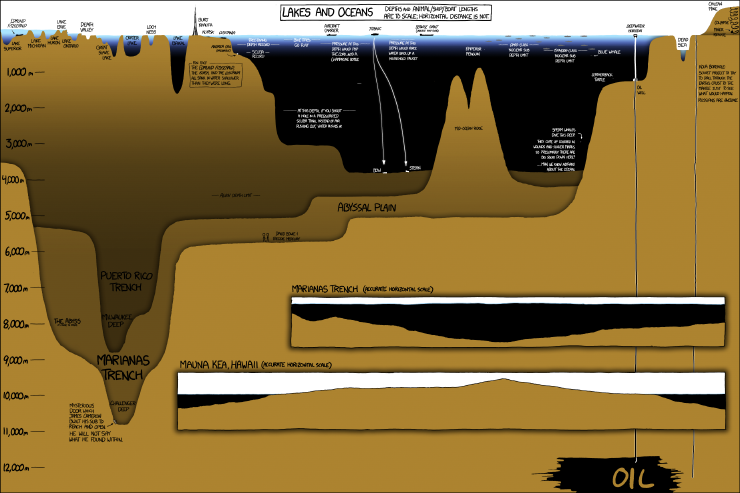
Original source: http://xkcd.com/1040/
I enjoyed my time in Seattle. The presentations by Jonathan Corum, Maria Popova, and Randall Munroe gave me a burst of energy that have let me approach my own work from a fresh perspective.

You must be logged in to post a comment.